04. Probability Distributions
概率分布入门 1
What is a Probability Distribution?
Probability distributions allow you to represent the probability of an event using a mathematical equation. Like any mathematical equation:
- probability distributions can be visualized using a graph especially in 2-dimensional cases.
- probability distributions can be worked with using algebra, linear algebra and calculus.
These distributions make it much easier to understand and summarize the probability of a system whether that system be a coin flip experiment or the location of an autonomous vehicle.
概率分布入门 2
Types of Probability Distributions
Probability distributions are really helpful for understanding the probability of a system.
Looking at the big pictures, there are two types of probability distributions:
- discrete probability distributions
- continuous probability distributions
Before we get into the details about what discrete and continuous mean, take a look at these two visualizations below. The first image shows a discrete probability distribution and the second a continuous probability distribution. What is similar and what is different about each visualization?
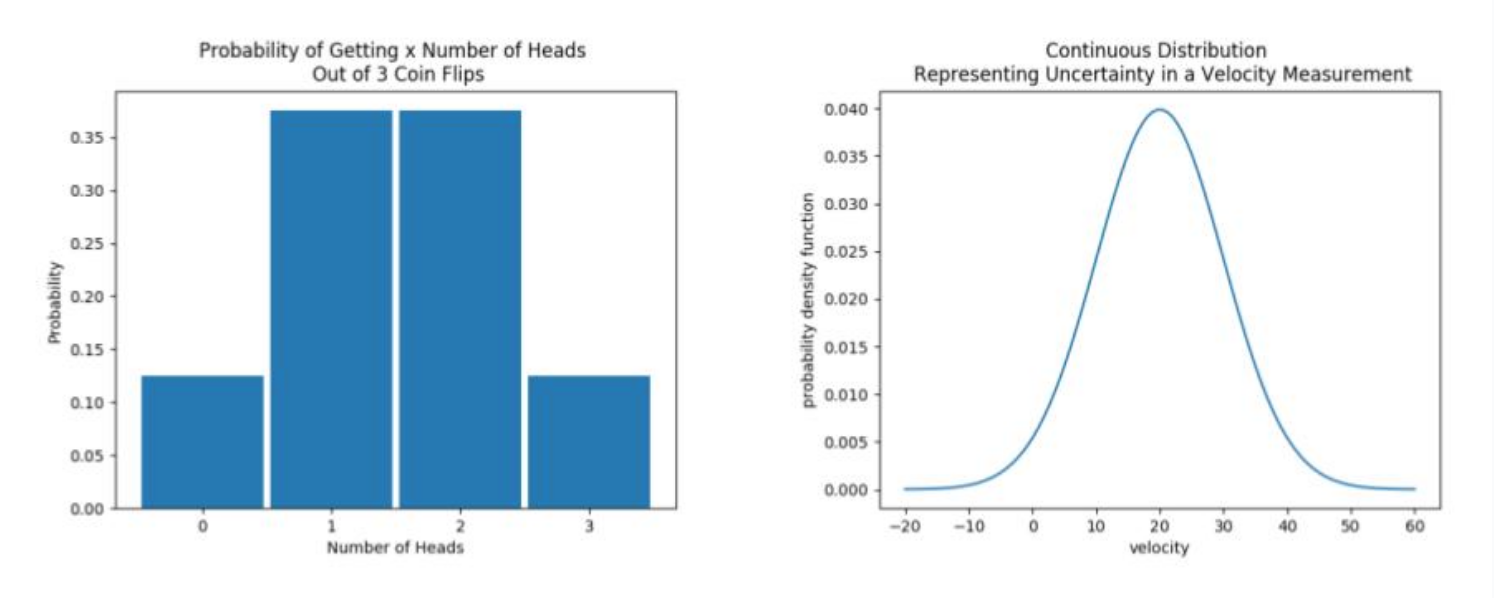
Discrete Distribution (left) and Continuous Distribution (right).
SOLUTION:
- The x-axis represents the main variable/event of interest for both visualizations.
- In the discrete visualization, the x-axis variable can only take on certain values such as 1, 2 or 3.
- In the continuous visualization, the x-axis variable can take on any real number value from -infinity to +infinity.
More terminology
- Prior - a prior probability distribution of an uncertain quantity, such as the location of a self-driving car on a road. This is the probability distribution that would express one's beliefs about the car's location **before ** some sensor measurements or other evidence is taken into account.
- Posterior - the probability distribution of an uncertain quantity, after some evidence (like sensor measurements) have been taken into account.
And you'll learn more about this terminology in the upcoming videos!